Analyzing email statistics & tracking with
the eworx Marketing Suite
Statistics are an essential part of email marketing campaigns. They help you to estimate your performance and give you some hints on the things you could improve. Therefore you should know how to analyze and interpret them. In this tutorial we want to explain the different parts of email campaign statistics.
Which evaluation options offer the eworx Marketing Suite statistics?
The eworx Marketing Suite statistics offer you a detailed evaluation of who opened your campaigns, which links have been clicked and much more – these information are the basis for further analysis and can be used for drawing conclusions – for example who is interested in which topics etc. – for your future campaigns.
The statistics of our newsletter system also offer the opportunity for an efficient reporting of course. You are also able to do further analysis in excel by exporting the eworx Marketing Suite data.
Which values am I able to get out of the campaign statistics?
The campaign statistics provides an overview over the success of every single campaign: Who opened the newsletter, which links have been clicked and much more. By clicking the button ‚Select campaign‘, a calender opens. The days on which you sent or planned newsletters are marked with a blue dot. On the right side you can see an overview over the campaigns sent on the respective day.

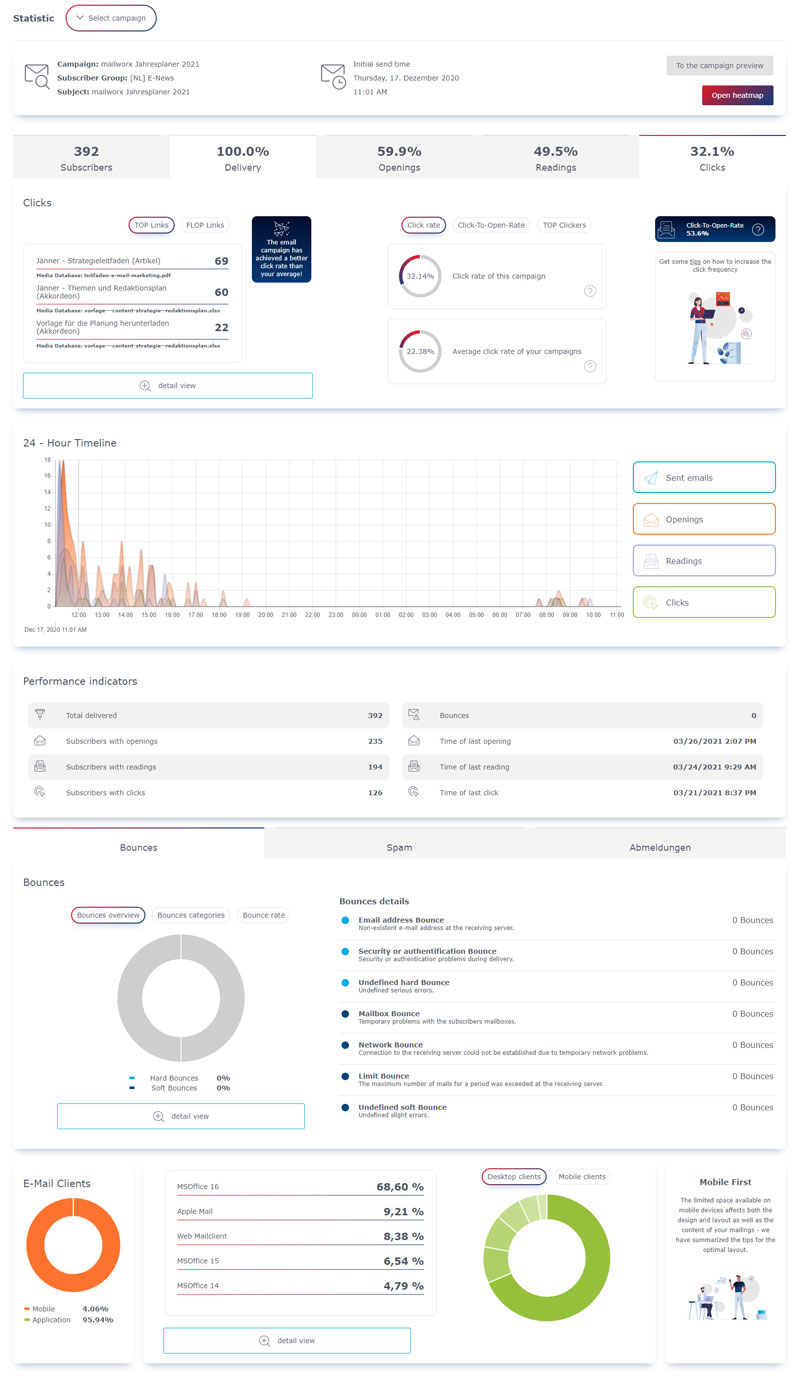
After choosing the relevant campaign, you can see all data of the newsletter campaign at a glance.

Statistics dashboard in the eworx Marketing Suite
In the overview of the chosen campaign you can see following facts:
- Campaign name: Here you get the naming you chose when creating the campaign – your subscribers can not see this name, it is only visible for you.
- Subscriber group: Here you can see the subscriber group to which you sent your campaign.
- Subject: This is the subject line of your sending.
- Information about the original sending: Here you can see the date on which you sent the original campaign. You can also regard the newsletter again by clicking the button ‚to the campaign preview‘.
Using the tab switchers, you can have a look at the detailed KPIs of the respective campaign. In the overview of the tabs you can also see how the performance of your campaigns changed.
A/B split statistic: When you sent your email campaign via A/B split test, you see the result of the test directly in the first tab. You can see the criteria used to choose the winner, like the opening rate in our example below. You also get the tested characteristic (which can be either the subject or the sender of your campaign) as well as the size of your test group. Additionally, you see at the first glance which of your tested campaigns was chosen as winner as well as the winning criterias of both campaigns in comparison.

Subscribers: Here you see immediately how many subscribers the campaign has been sent to. The circular chart shows also how many subscribers have been excluded, deactivated, without consent or have another language. Next to this you get an overview over why subscribers have been excluded.

Delivery: In the tab ‚Delivery‘ you can see, which percentage of mails have reached the mailbox of your subscribers in which timespan. The curve chart next to this shows the delivery period in hours. Tip: In the tab ‚Delivery‘ you directly get some tips on how to improve your delivery rate.

Openings: Here you can see the opening rate of the recent campaign as well as the average opening rate of the last campaigns in comparison. According to this you can also see the campaign performance, whether it performs better or worse than the average. You also get information about openings by regions or location.

These tips help you to improve your opening rate:
- Choose the right sender:
It should be clear for your subscribers from who the email has been sent even before opening it. You do best by sending your newsletter from an address that can be traced back to your company – do not use no-reply addresses. - Pay attention to the subject and preview line:
Formulate your subject line in a way that your subscribers want to open the newsletter. They should get a clue on the newsletter content. The preview line can be seen as extension to the subject line. In both cases it is important to pay attention to the limited space. - Align the delivery time to your subscribers:
The time when you send your newsletter is significant for your opening rate. The best sending time for your email campaign depends on your industry as well as the respective target group. - Have a look at your delivery rate:
The opening rate is associated with the delivery rate of your newsletter, because the newsletter can’t be opened when it didn’t land in the mailbox. Watch out for spam trigger when creating your campaign – if your sender is trustworthy, your newsletters will be delivered.
Reading rate: In the tab ‚Readings‘ you can see the percentage of subscribers that did read, scan or not read the newsletter. Here you get also a hint on the performance of your campaign. In the dashboard you can see the reading rate, the read-to-open rate as well as the TOP readers of your campaigns. Tip: In the tab ‚Readings‘ you directly get some tips on how to increase your reading rate.

These tips help you to improve your reading rate:
Decisive for increasing the reading rate is that your subscribers busy themselves with your newsletter. Therefore, offer content that captivates:
- Impart values and emotions:
With storytelling you can address your subscriber emotionally. Do not only think about positive feelings, don’t be afraid to speak about sore points and fears. By telling stories your subscribers keep reading your newsletter. - Deliver relevant content:
Subscribers will only read your newsletters when you offer content that is relevant for them. Create your content informative and watch out for the preferences of the single readers – the eworx Marketing Suite iRated® Technology does the relevance sorting for you. - Use interactive elements:
Interactive newsletters not only increase the readers‘ interests for your content, but it also increases the time span your readers interact with your email – and thus in turn your reading rate. By using accordions, image sliders or countdowns, you shorten the conversion path. - Ask your readers:
If you are not sure which content is relevant for your readers, simply ask them! Use surveys in newsletters and let your subscribers choose the topics for your next campaigns. By doing that you ensure that these are relevant for them and you additionally have some input for your future sendings.
Clicks: Here you get an overview over the TOP and FLOP links in your newsletter campaign. Furthermore the KPIs click rate, click-to-open rate as well as the TOP clickers of your sendings can be shown. The detail view gives you a hint on the links in your campaigns, it shows the link description, the section that contains the link as well as the clicks on the link.

These tips help you to improve your click rate:
Basically, you should make it as easy as possible for your newsletter readers to click. You do best by using calls-to-action in the form of buttons.
- Position calls-to-action flashy:
Place CTAs in the visible area, best always in connection with the corresponding topic. Place those links in the text area, because images are not visible for every reader or rather those pictures have to be downloaded actively. - Watch out for the design:
It is not only important that the buttons contrast from the rest, but especially, that there is enough space around the buttons so that it can be clicked easily. When you use colorful buttons, you should orientate on the corporate design restrictions of your company. - Do not use too many CTAs at a time:
Use short teaser texts that link to pursuing articles – but do not exaggerate. Too many buttons can be disturbing, so think about where the use of a call-to-action is really useful. - Create buttons meaningful:
The space on buttons is limited, therefore you should watch out that you formulate them shortly. Use bullet points that point out the value of the link.
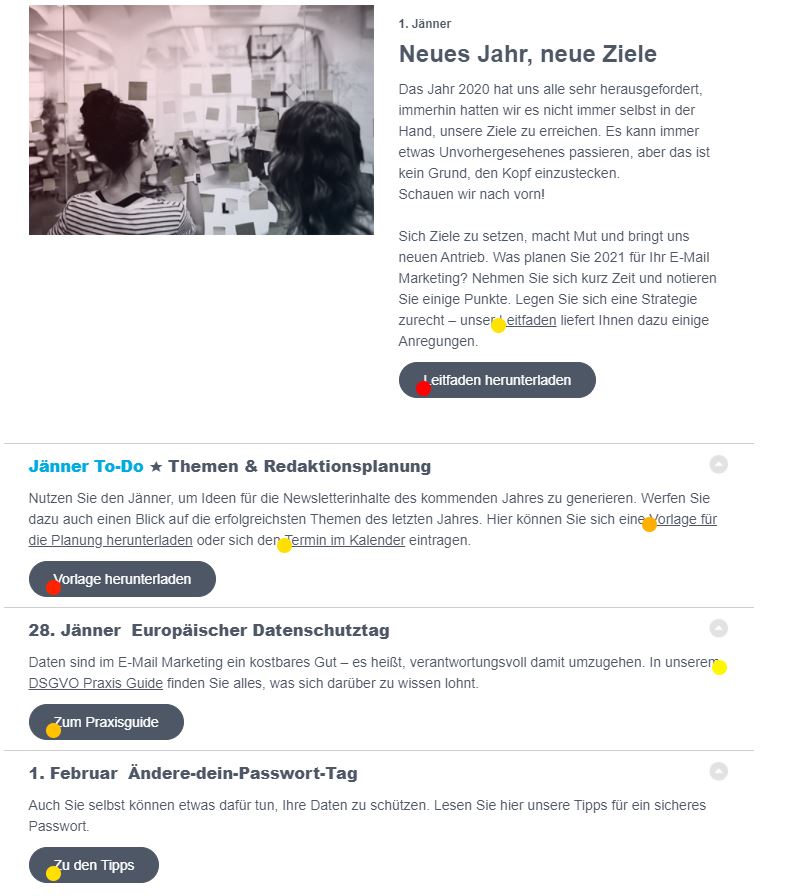
A very useful feature in the mailworx statistics is the heatmap: It shows the preview of your newsletter campaign, detailed link clicks inclusive.

Under the dashboard of the single tab switcher you can find further opportunities of analysis:
24 hours timeline: The curve diagram gives you an overview over the sent emails, total openings and clicks as well as the total readings – thereby you can see the performance of your campaigns within 24 hours and also when your subscribers open or click your newsletter.

Performance indicators: To the most important KPIs count the number of delivered emails, the number of subscribers that opened, read and clicked the newsletter. In addition you can see the number of bounces and the point of time is shown when the last subscriber opened and read your newsletter or clicked a link.

For detailed analysis you can switch between the tabs ‚Bounces‘, ‚Spam‘ and ‚Unsubscriptions‘.
Bounces: Here you get an overview over the bounces, divided into hard and soft bounces. Next to this you get information on the single bounce categories – read more about that in this section.
These tips help you to impove your bouncerate:
- Keep your data base clean:
Have a look at subscribers that don’t react to your sendings for quite a time and try to win them back as active subscribers by sending reactivation campaigns. If you have no success, you should delete those contacts. - Only send to subscribers with permission:
Use the so-called double-opt-in in order to get the explicit permission of your subscribers. Do not purchase any email lists – not only that those contacts have nothing in common with your company. Also your reputation can be affected negatively when the spam trap snaps. - Avoid spam trigger:
mailworx shows you whether your newsletter contains spam words even before sending by doing an anti-spam check. You should also ensure a balanced ratio between images and text. - Have a look at your timing:
Even in this case, the delivery frequency plays an important role: Too many newsletters can bother your subscribers, but sending newsletters too erratically can be a sign for spam mail.
Spam: In the tab ‚Spam‘ we have some helpful tips for you on how to avoid that your sender is marked as spam. Next to this you get an overview ober the spamrate of the recent campaign as well as the average values of the last campaigns. Tip: In the tab ‚Spam‘ you directly get some tips on how to improve the delivery rate of your newsletters.
Unsubscriptions: Here you get a list with tips in order to avoid that readers unsubscribe from your newsletters. Next to this you see the unsubscription rate of the recent campaign compated to the one of your last newsletters.
These tips help you to improve your unsubscription rate:
- Let your subscribers decide how often they want to get your newsletter:
The delivery frequency of newsletters is very important. If you send newsletters too often, your subscribers may be annoyed. Use a survey to ask when and how often your subscribers want to get your newsletters. - Offer the opportunity to choose newsletter subjects:
Also WHAT your subscribers want to read in your newsletters can be asked in a survey within a newsletter. This gives you certainty that your readers find your content as interesting as you do and you also get a pool of new ideas. - Check your subscriber data regularly and clean your email list:
Subscriber data can be enriched time after time. Think about keeping contact data like names and email addresses up-to-date but also check if your subscribers‘ interests are on current status. - Offer unsubscriptions from different newsletter types:
By offering the opportunity to unsubscribe from different newsletter types you may keep some subscribers from unsubscribing from your whole email marketing campaigns. Ask your subscriber which newsletter he or she does not want to get any longer when clicking the unsubscribe link.
At the end of the statistics overview you get an insight in the email clients: In the circle diagram you can see, whether subscribers opened more likely on desktop or mobile devices. Next to this there is an overview over the desktop as well as mobile clients. Tip: In the section ‚Email clients‘ you directly get some tips regarding the Mobile First approach.
Which bounce categories can mailworx differentiate?
mailworx differentiates bounces into hard and soft bounces. These are divided in turn into different categories on basis of the reason for the bounce.
Hard bounces are severe, permanent errors in delivery. Often appearing hard bounces are deactivated by
the eworx Marketing Suite automatically.
By doing so, the quality of your data as well as the delivery will improve as many email providers like GMX, Yahoo, Google etc. don’t like it when you send to non-existent addresses often. Email addresses that are not existing today won’t be correct the next time you send a newsletter.
Hard bounces in the eworx Marketing Suite are:
- Email address status: This points out non-existing email addresses at the receiving server.
- Security or authentification status: These bounces give a hint on security or authentification problems in the delivery of the newsletter.
- Undefined hard bounce: These are undefined errors which are categorized as hard bounces.
Soft bounces are slight, temporary errors in delivery. Hereby, addresses can be deactivated when the defect appears often in a row. Soft bounces point out abandoned email addresses that can’t be requested anymore. If you change the non-existent email address it will be activated again. If an address is deactivated by many bounces, it will still be existing in mailworx. By deactivating the email address automatically, they won’t simply be fed anymore.
Soft bounces in mailworx are:
- Mailbox status: This shows temporary problems of the subscribers‘ mailboxes.
- Network status: This points out that there have been defects in delivering the newsletter.
- Limit status: Hereby the newsletters could not be delivered because the limitation of the receiving server has been exceeded.
- Undefined soft bounce: These are undefined defects which are categorized as soft bounces.
How can I compare the results of various email campaigns?
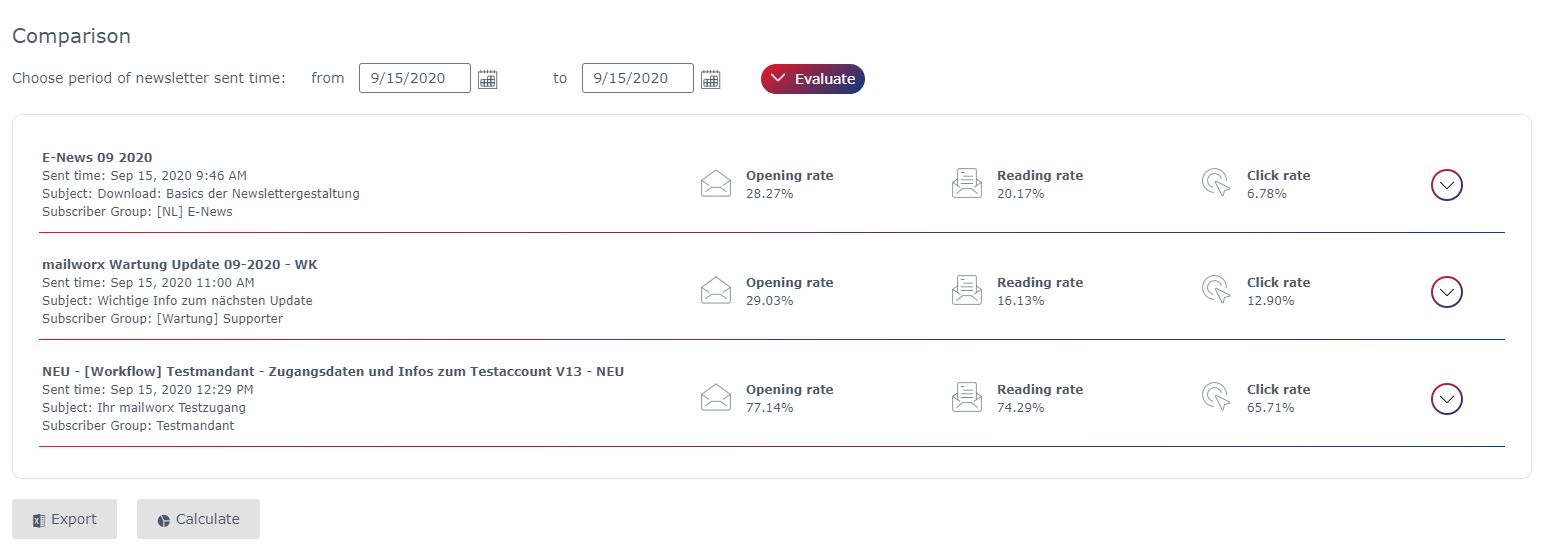
In the statistic ‚Campaign comparison‘ you can compare campaigns you sent in a determined timespan. By clicking the button ‚Compare‘ you can get an overview over the KPIs opening rate, reading rate as well as click rate of the campaigns in the chosen timespan. After you clicked the arrow next to the campaign overview, you get some detailed views to the TOP links of the respective newsletter campaign.

You have the opportunity to select single campaigns by activating the checkbox in order to get a deeper overview over the campaign performance. You then get the average as well as maximum and minimum values of the indicators delivery, openings, reading rate, clicks and bounces.

What am I able to evaluate in the statistics ‘Ranking & analysis’?
In the area ‚Ranking & analysis‘ you can switch between the tabs openings, reading rate and clicks. Choose the timespan of the sent newsletters you want to regard. Here you can also compare different subscriber groups regarding the single indicators depending on the tab.
You can also choose whether you want to see absolute or relative values of the KPIs reading and click rate.
In the table you can see the ranking of the newsletter in the respective timespan – at a glance you can see the performance of your newsletter based on the KPIs openings, reading rate as well as click rate.
How to export results from the eworx Marketing Suite statistic tool?
You can export the respective data in different areas of the mailworx statistics. When clicking the button ‚Export‘ you have the opportunity to get diverse lists as csv-files of the campaign statistics for further analysis.
mailworx summarizes the data for you: Choose the fields you want to export by marking them. You can save the data on your computer by clicking ‚Save‘ in the window that opens.
Where can I see the number of mails I sent?
Under ‚Statistics – Number of deliveries‚ you can see, organized in months, which campaigns you sent to how many persons via the newsletter system. At the end of each list you can see the total number of mails sent.
Are there any evaluations about my subscribers?
Of course you get also a perfect overview over your subscribers. You can either click on the ‚Subscribers‘ tab in the campaign statistics section in order to get an overview over the subscribers of the campaign you want to analyze. For a detailed evaluation of your subscribers, change to ‚Subscribers‘ in the main menu. By doing this you get to a clear subscriber dashboard which provides perfect overview over your subscriber base. In some areas our newsletter system presents you even more detailed data – so you can analyze in even more depth.
More about the subscriber dashboard and the respective KPIs as well as analysis is summarized in this whitepaper.